Flux AI Image Generator
Open main menu
Flux.1
Herramientas Gratuitas
Flux Lora Models
New
Precios
Toggle theme
ES
Sign in
Flux AI Image Generator
Close menu
Flux.1
Herramientas Gratuitas
Flux Lora Models
New
Precios
Toggle theme
ES
Sign in
19 Free climate change AI images Create by
Flux AI
Flux.1 AI Image Generator
Flux Schnell
Flux Dev
Flux Pro
Related Tags
cyberpunk
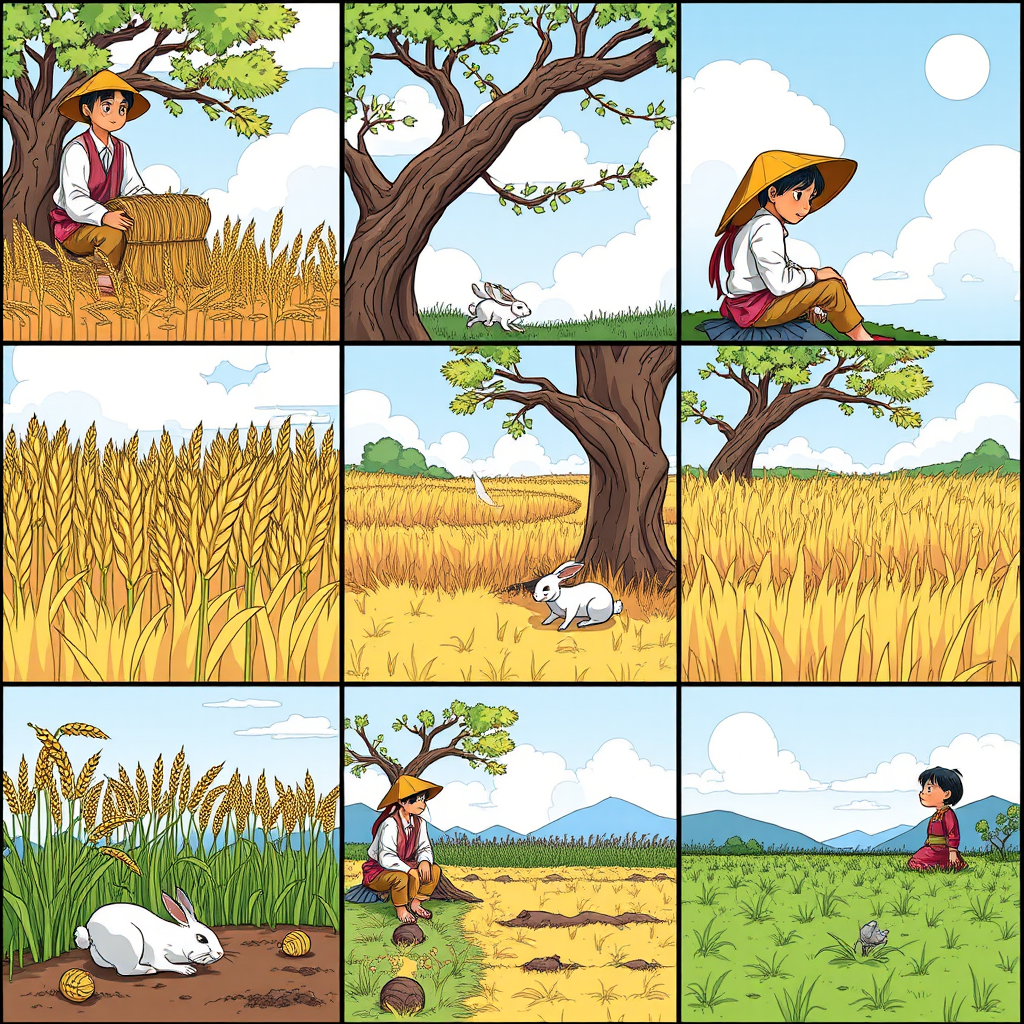
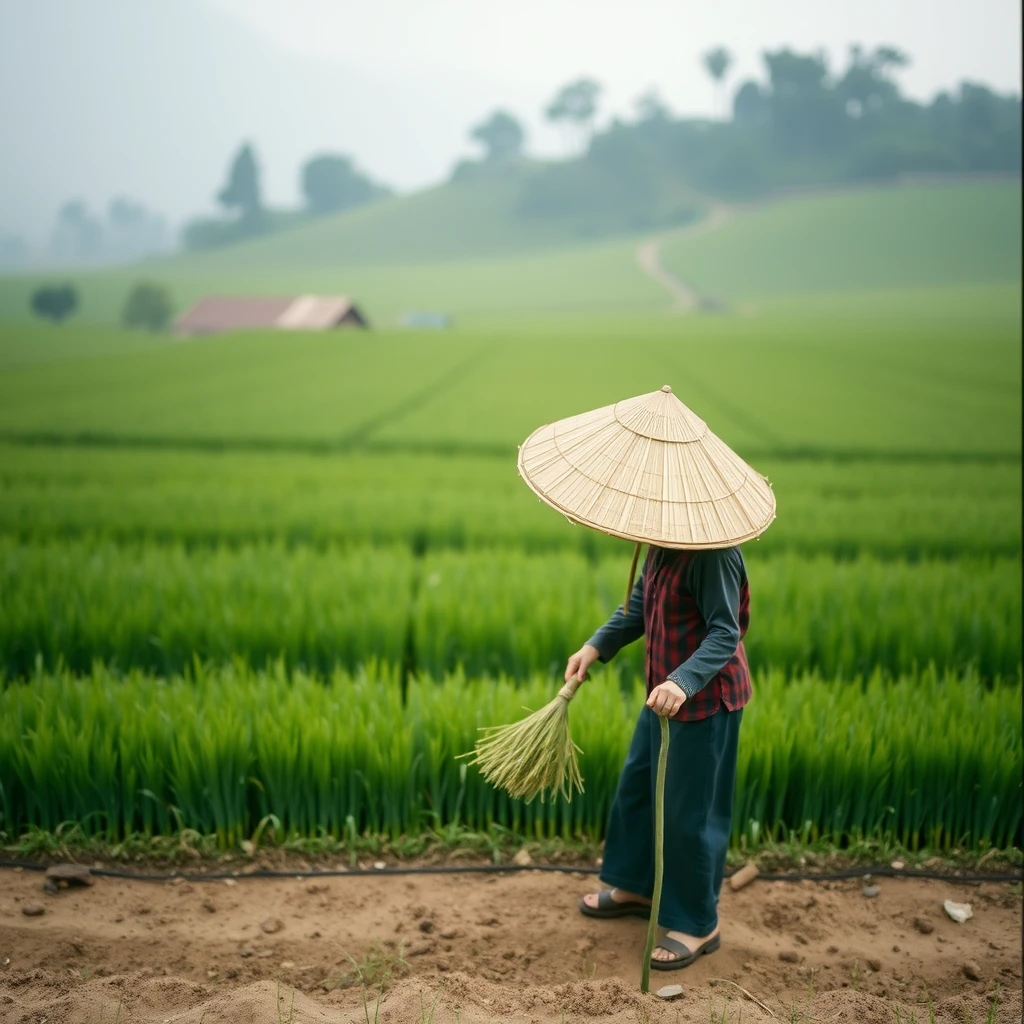
farmer
agriculture
storytelling
climate change
melancholy
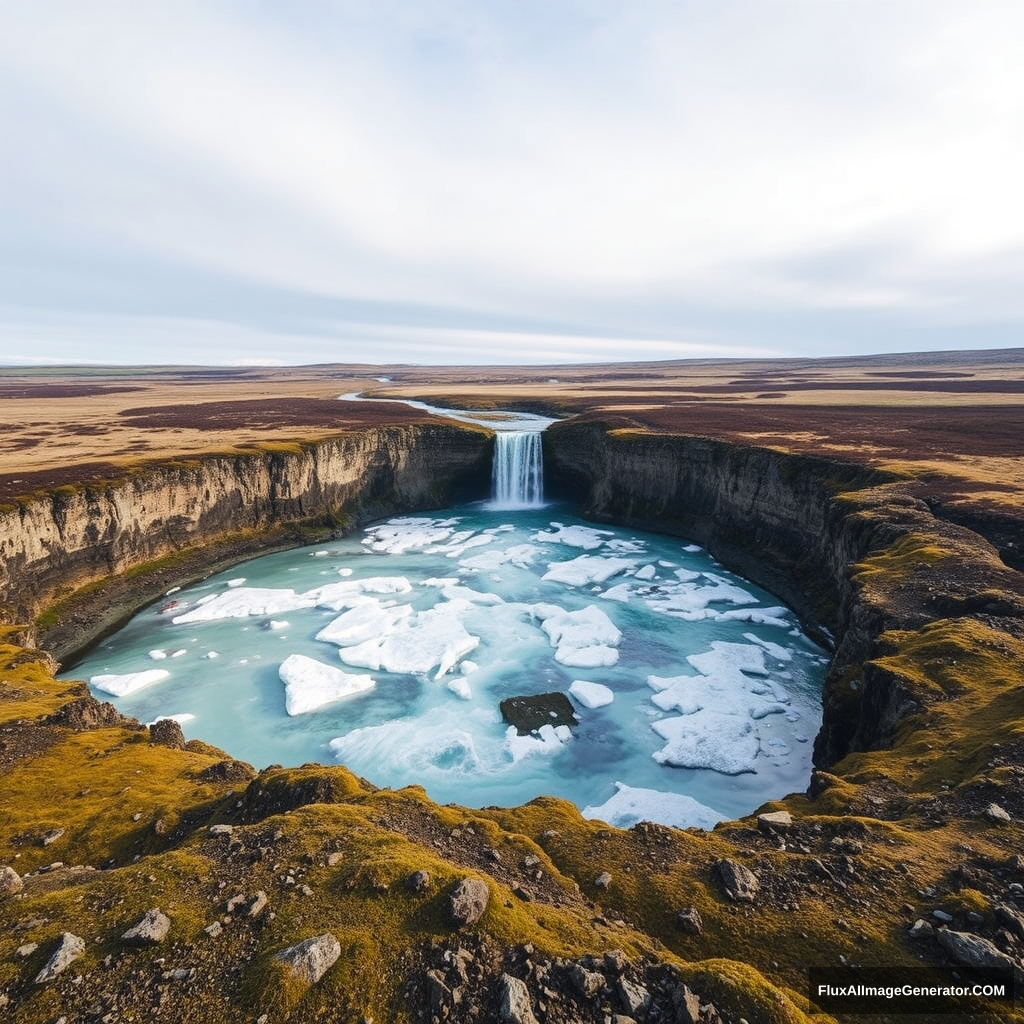
Iceland
ice formations
glaciers
tourism
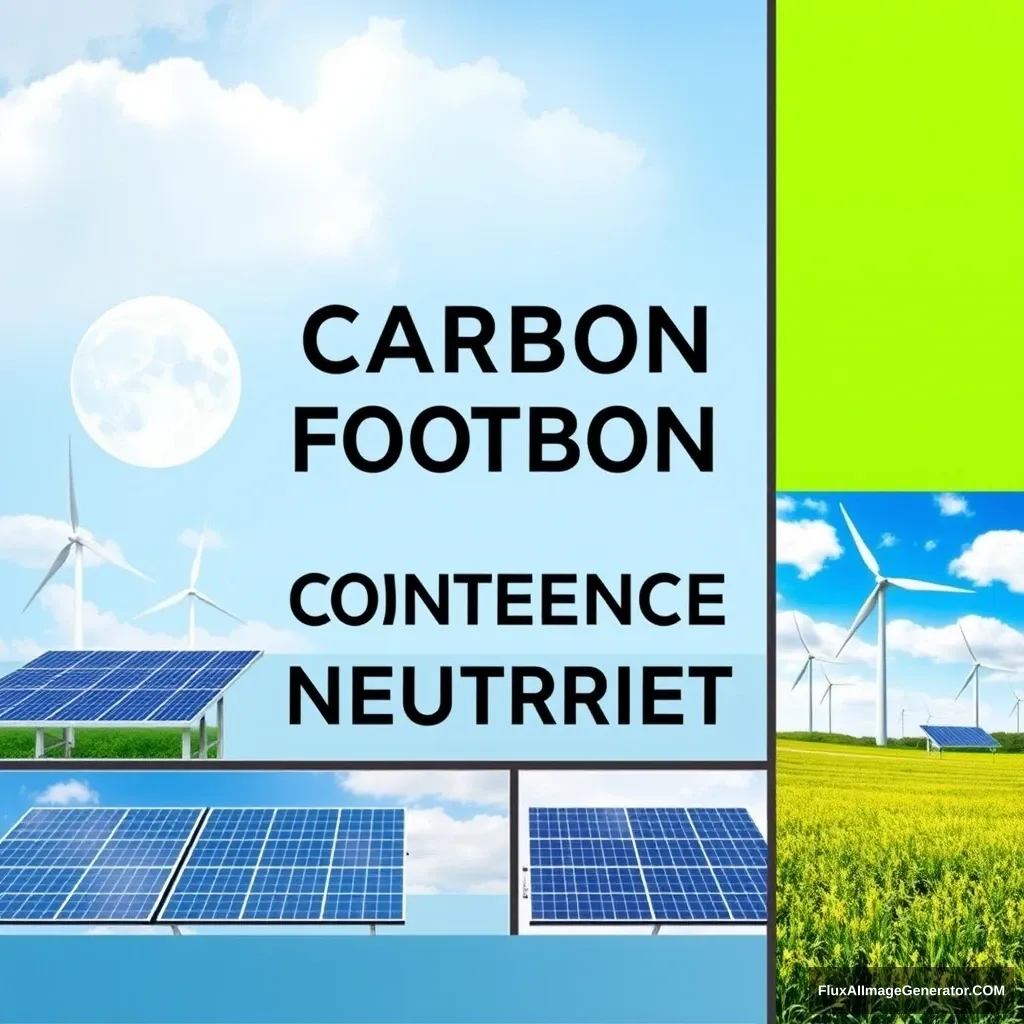
carbon neutrality
green energy
sustainability
environmental policy
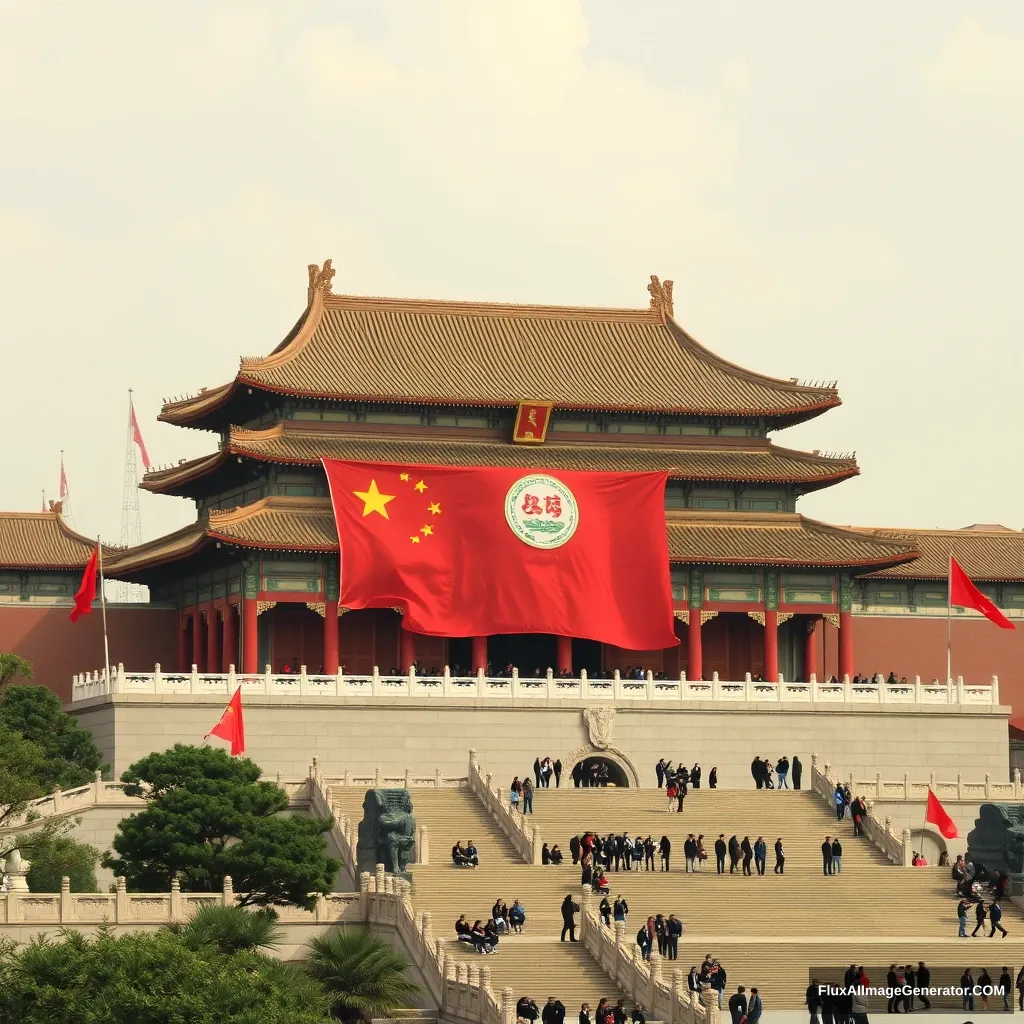
Chinese government
policy analysis
international relations
technology
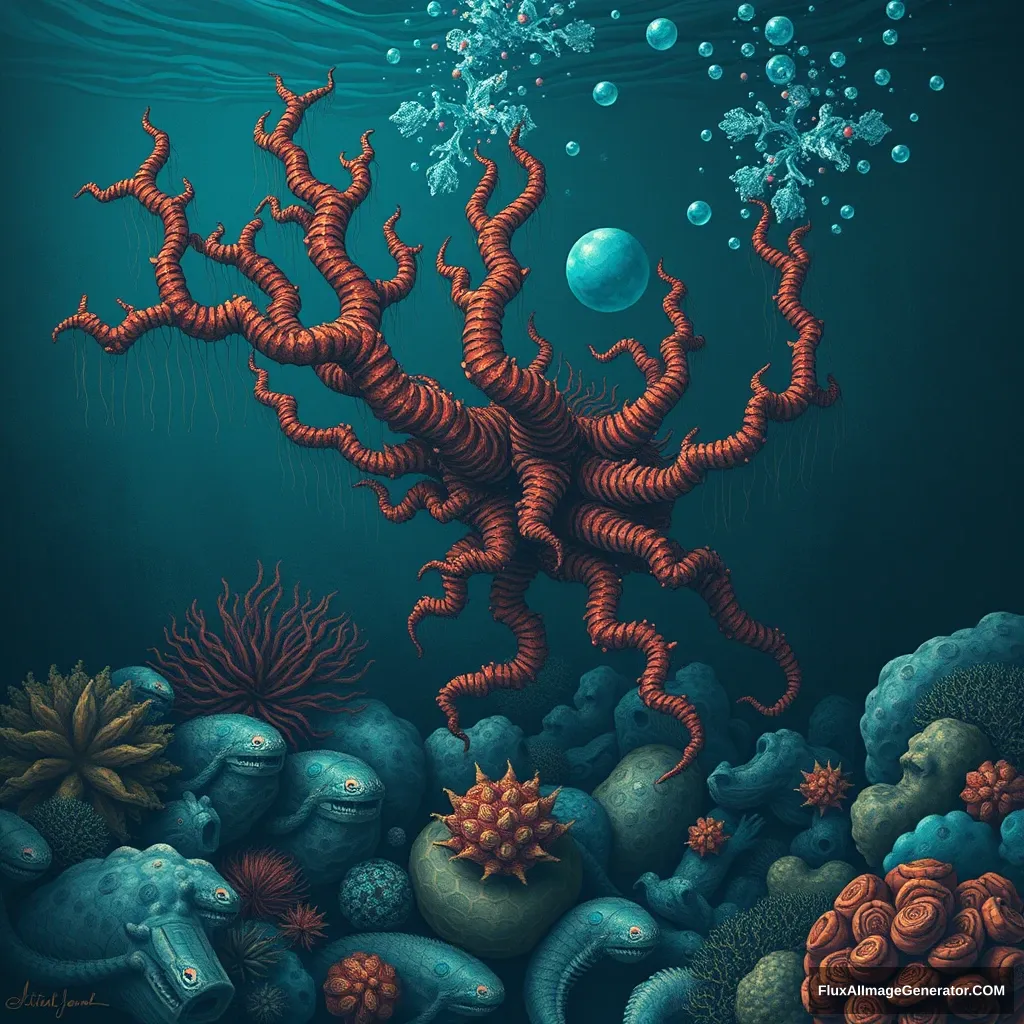
deep sea
marine research
oceanography
biodiversity
apocalypse
existential crisis
survival
human resilience
economy
cultural studies
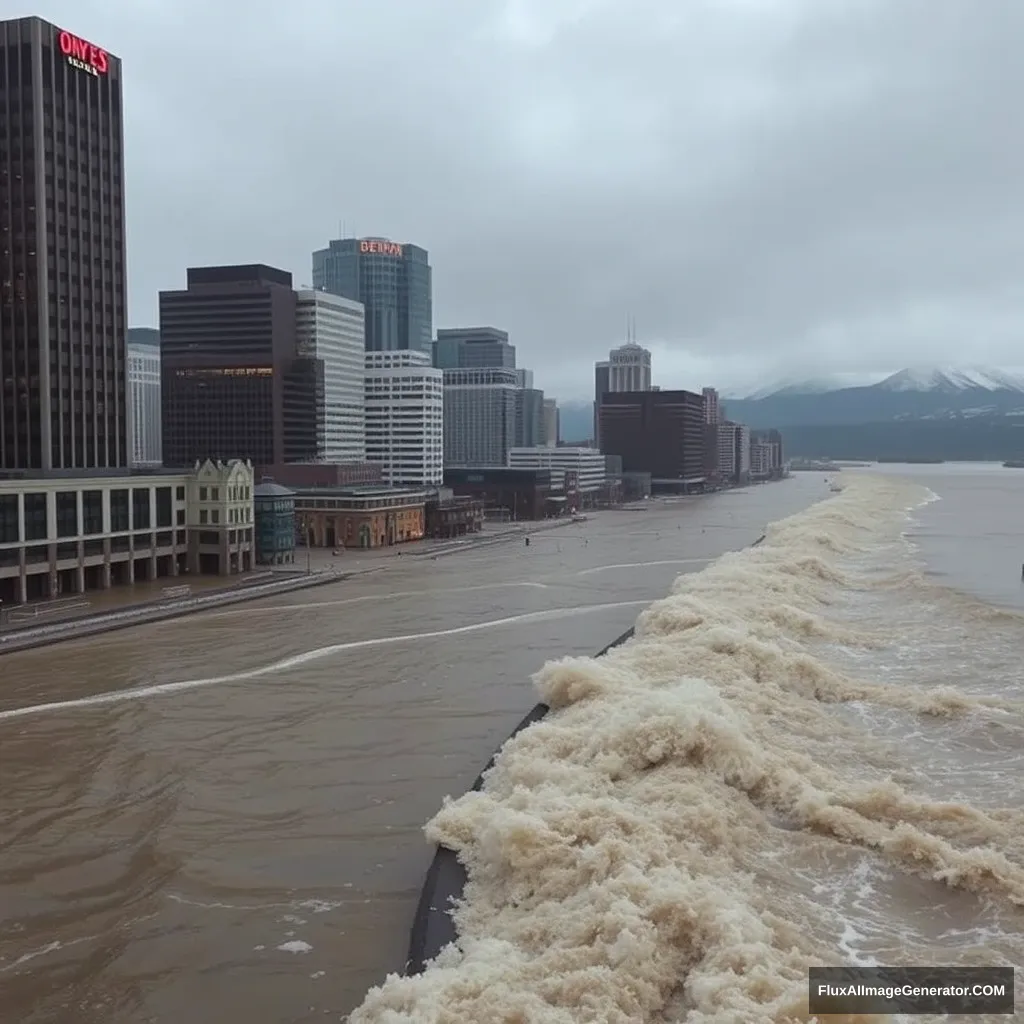
tsunami
urban flooding
disaster impact
Denver
risk assessment
environmental impact
adaptation strategies
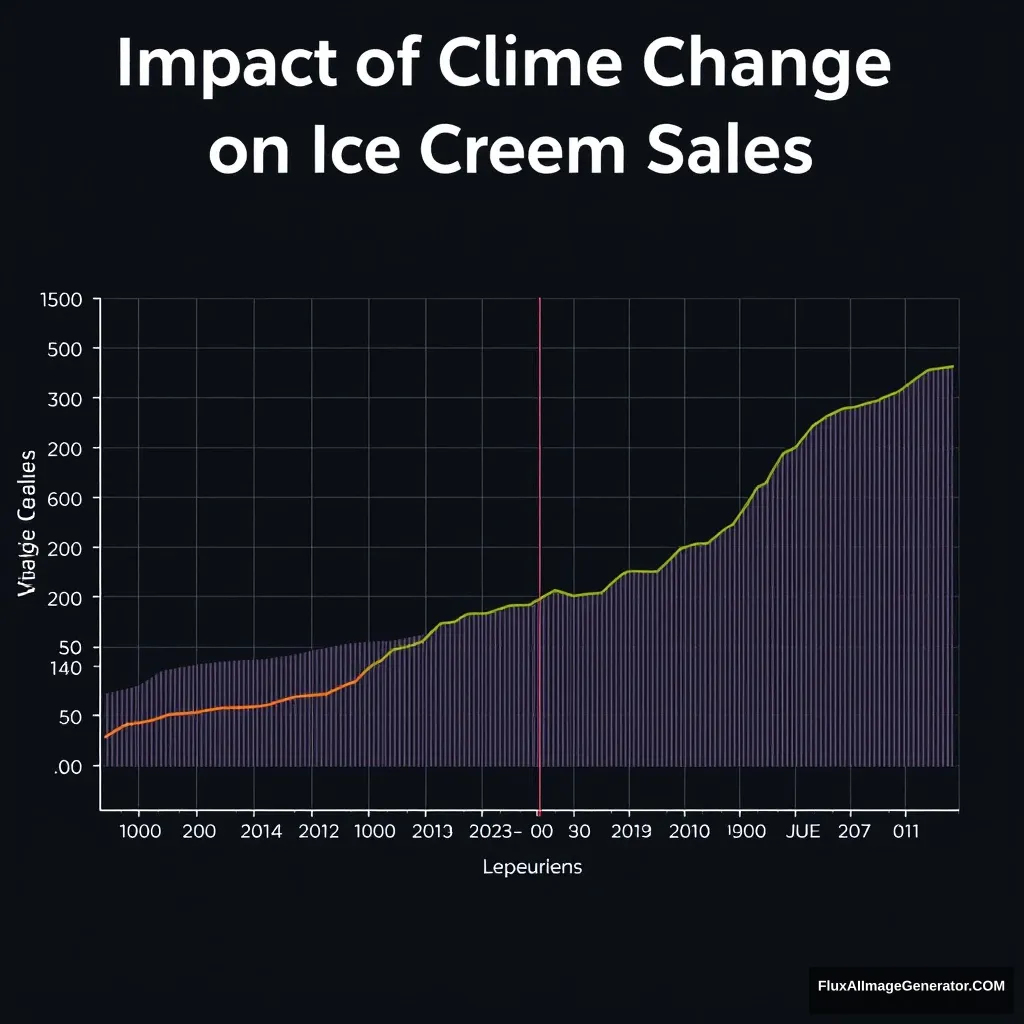
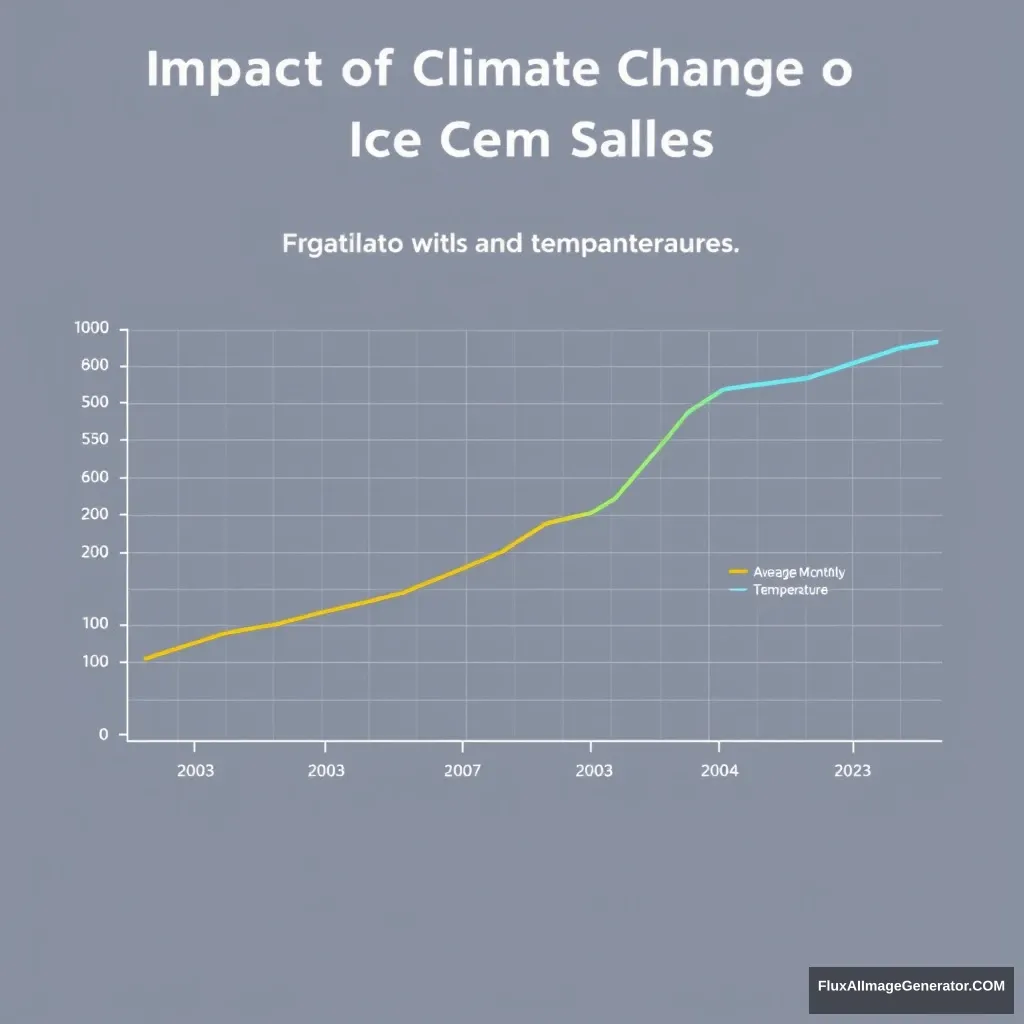
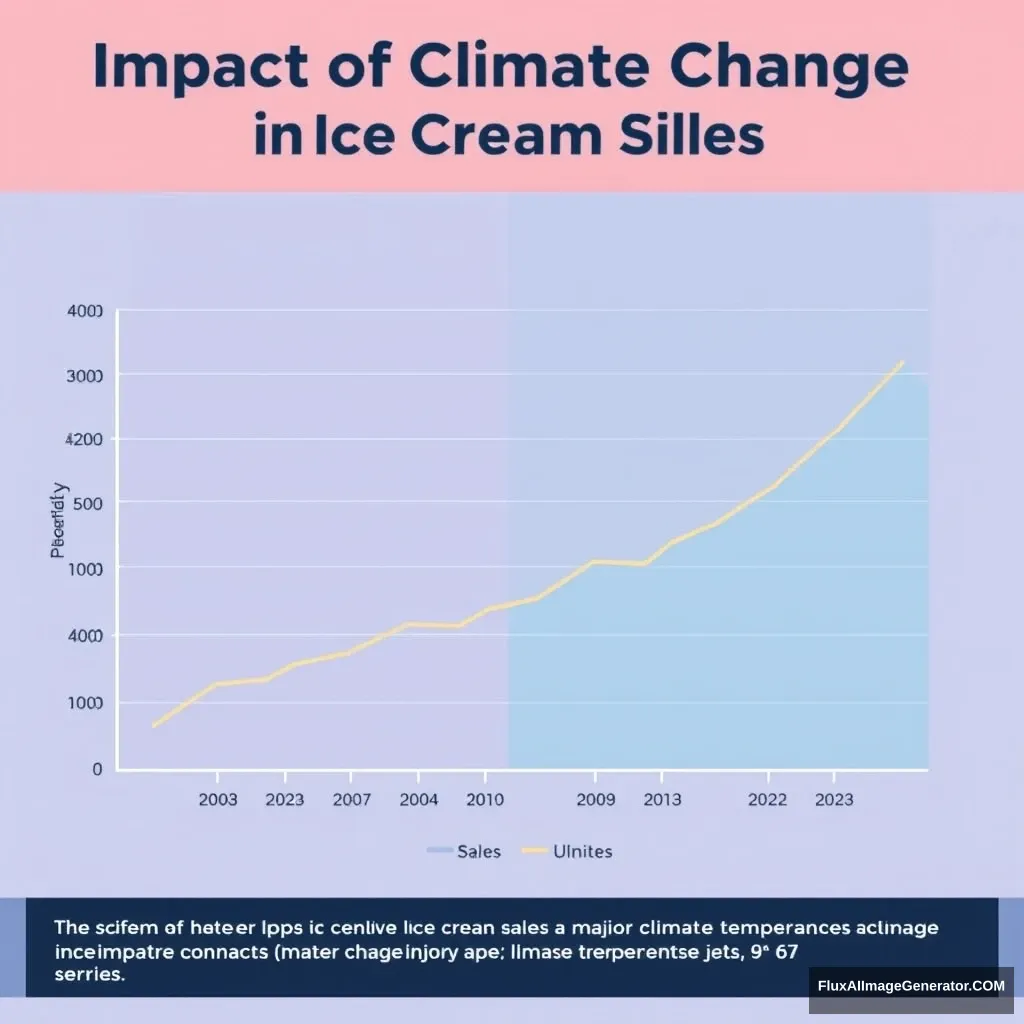
ice cream sales
data visualization
academic publication
market trends
average temperature
data analysis
temperature impact
consumer behavior
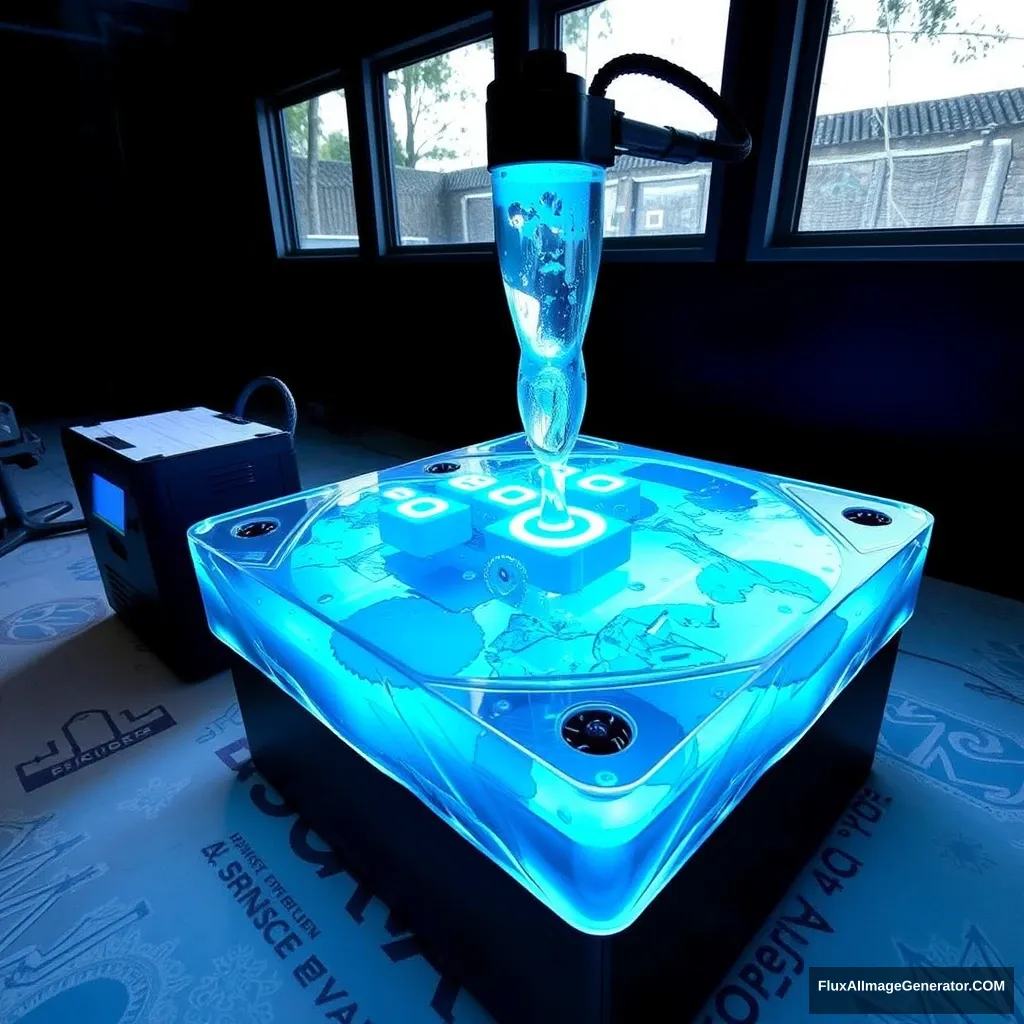
ice printer
stratosphere
innovation
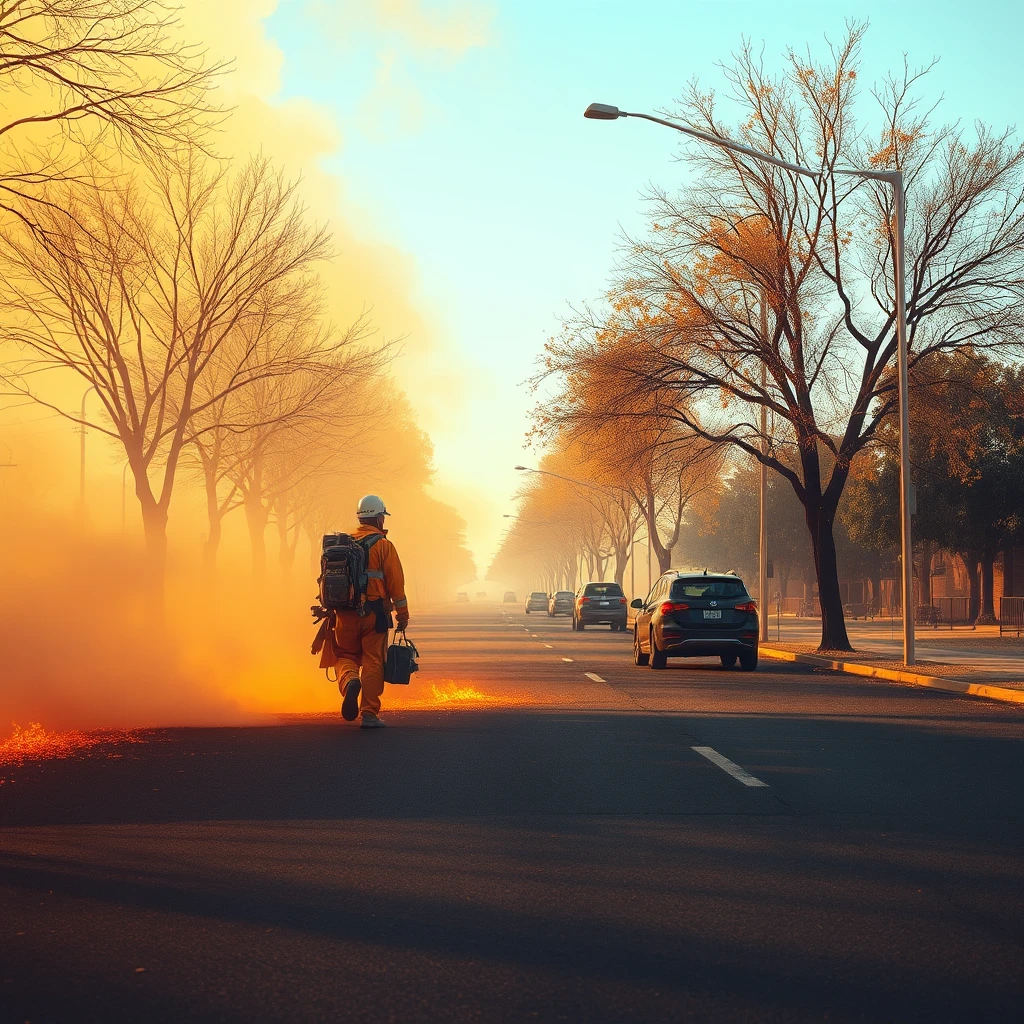
heatwave
urban environment
worker safety
photography
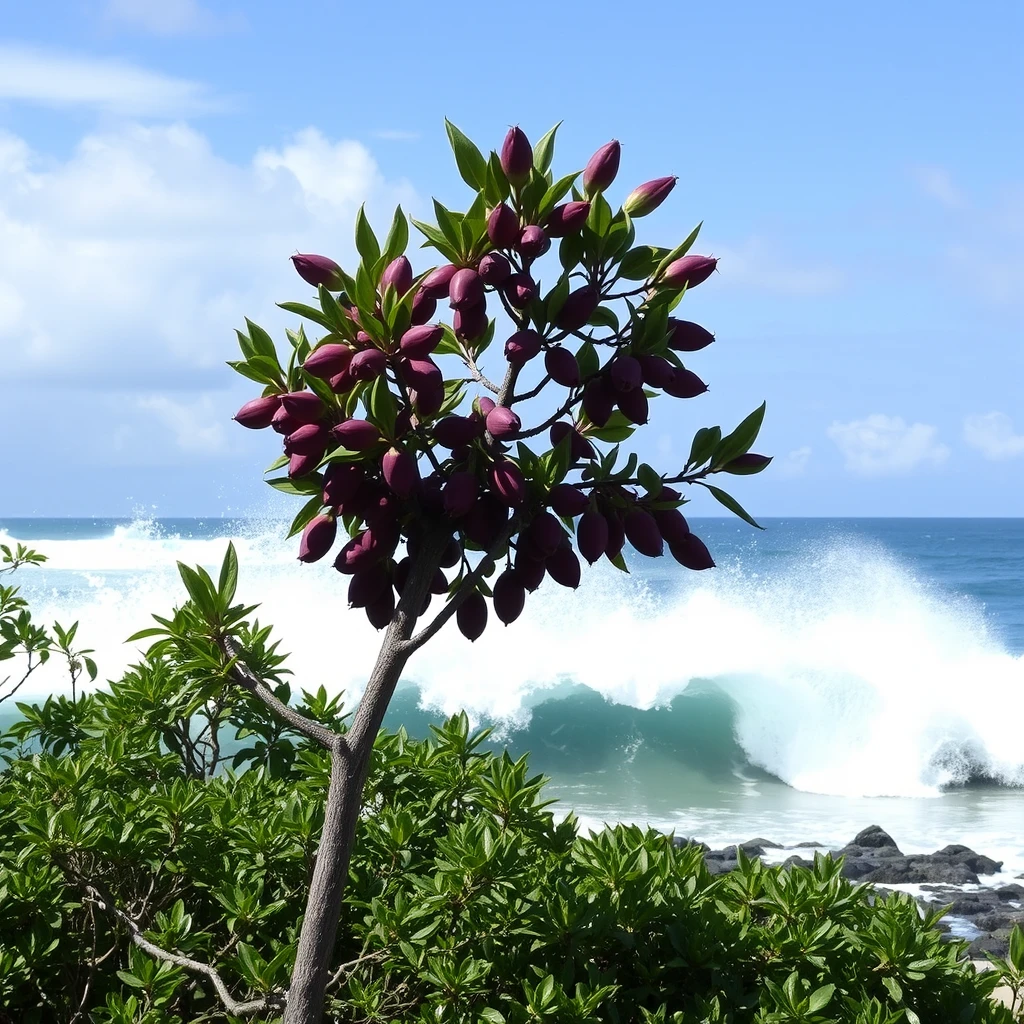
pitaya tree
tidal wave
natural disaster
environmental resilience
beach environments
coastal processes
geological studies
urban planning
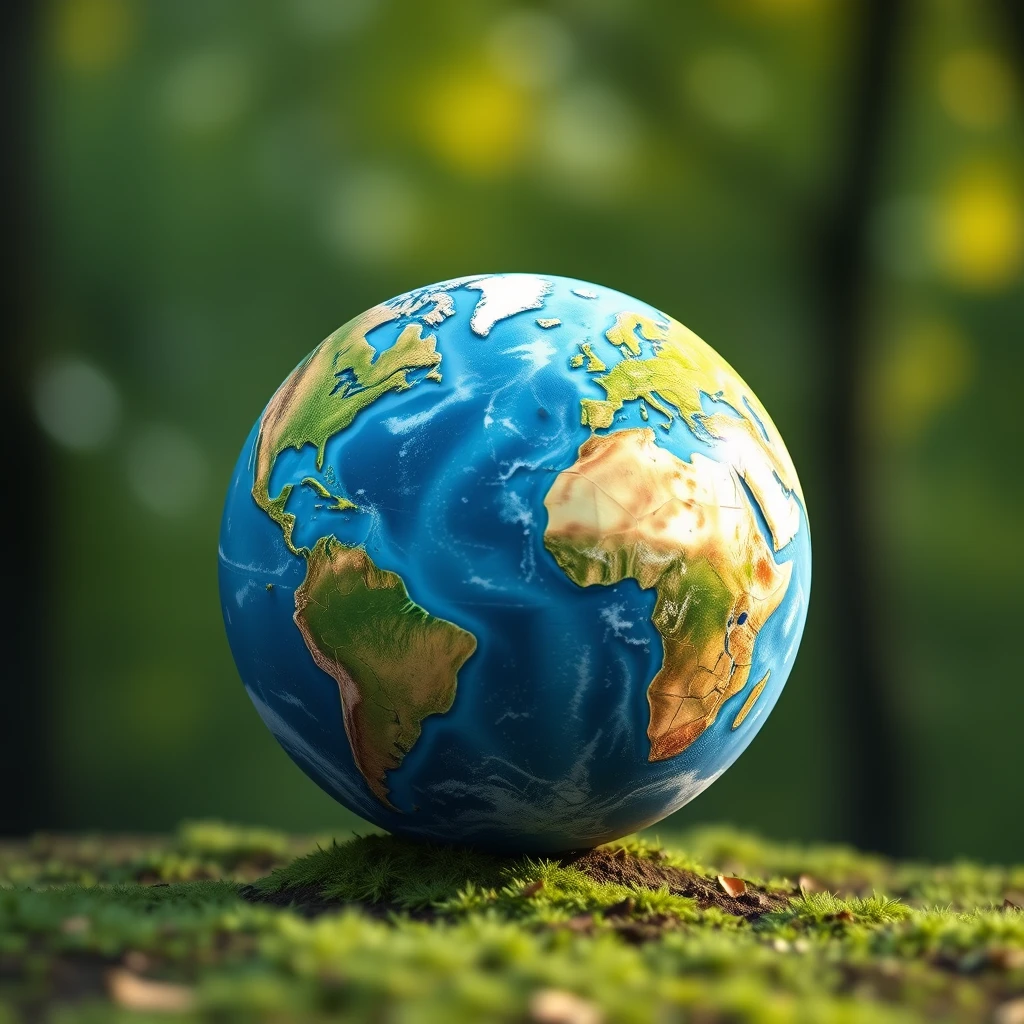
environment
Earth
humanity
plein air painting
environmental art
high key lighting
disaster themes