Image IA créée par Flux AI Image Generator

Analyse d'image
Analyse émotionnelle
Scénarios d'application
Eco-Investing Report Presentation
Description: An investment firm presents a quarterly performance report focused on eco-investing.
Utilisation potentielle: To showcase positive trends and attract potential investors interested in sustainable investments.
Public Awareness Seminar
Description: A public seminar on the importance of green investment banking.
Utilisation potentielle: To educate the public and potential investors about the benefits of eco-investing through visual data.
Eco-Investment Product Launch
Description: A digital marketing campaign promoting a new eco-investment product.
Utilisation potentielle: To utilize engaging visuals to capture interest and convey the success of green investments.
Webinar Series on Eco-Investing
Description: Eco-focused investment webinars discussing market trends.
Utilisation potentielle: To provide data-driven insights using charts that demonstrate fluctuating positive trends in eco-investments.
Green Investment Performance Dashboard
Description: An interactive online dashboard for tracking green investment performance.
Utilisation potentielle: To allow users to visualize their investments and track the performance of eco-themed stocks.
Analyse technique
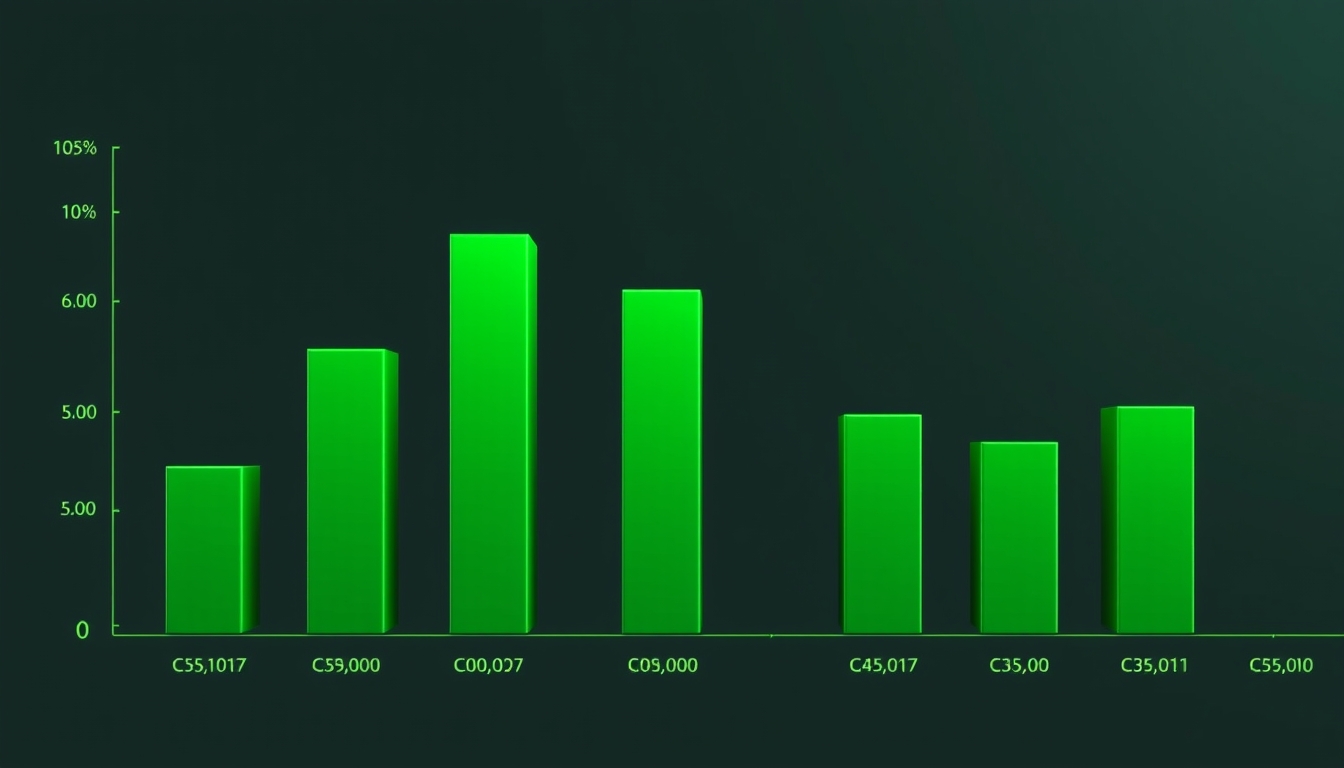
Évaluation de la qualité: High-quality visual representation with clear communication of positive trends in eco-investing.
- Dynamic use of color to represent positive trends
- Effective use of bar charts for comparative analysis
- Clear visuals that enhance understanding of market fluctuations
- Ability to convey complex information in an engaging manner
- Incorporating more detailed data analysis
- Adding interactive elements to charts
- Improving the clarity of visual representation
- Enhancing the accessibility of information