Image IA créée par Flux AI Image Generator
Invitation
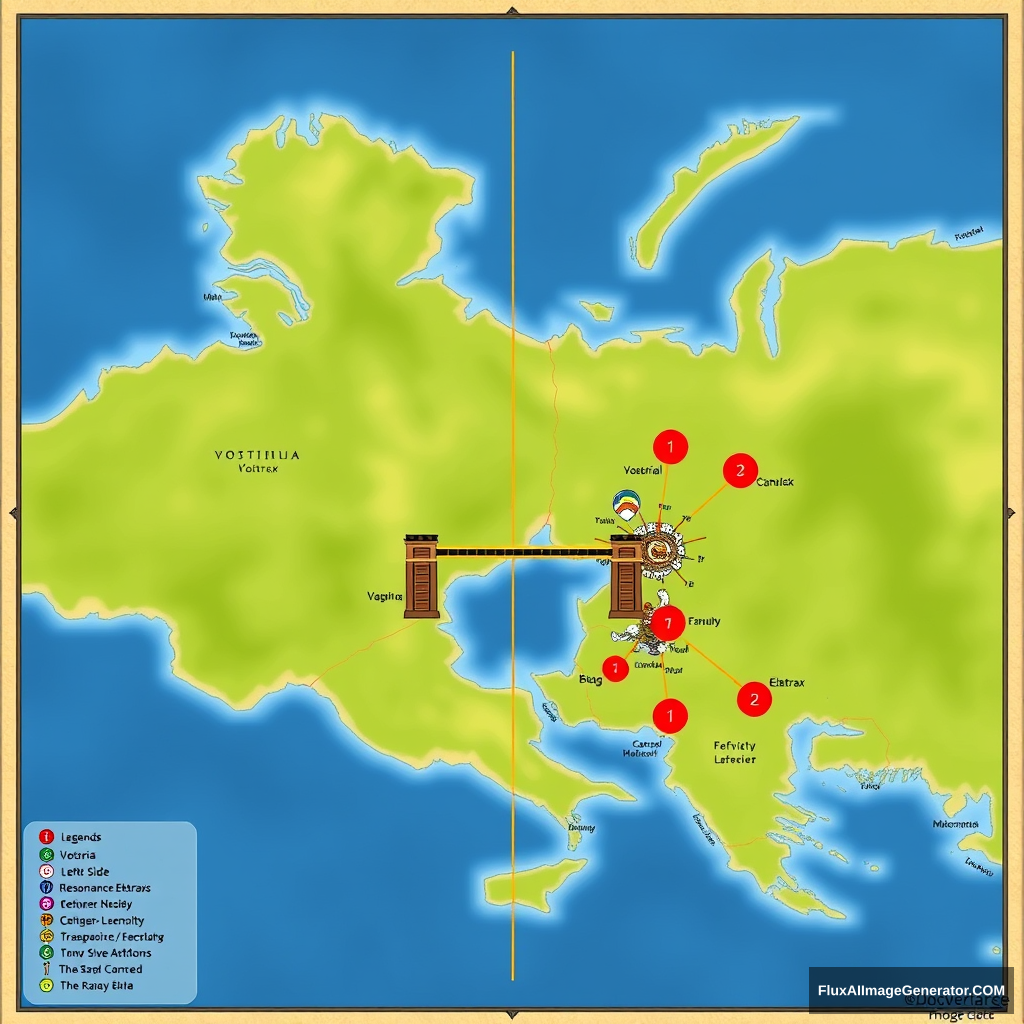
The map is divided into two distinct halves: Left side (blue): Vostria Right side (green): Eletrax The Divide/Resonance is clearly indicated by an orange vertical line running centrally through the map. The Bridge is illustrated as a brown rectangle spanning across the Divide at the heart of the map. The capital cities of both Vostria and Eletrax are marked by prominent red circles. A legend is provided at the bottom left corner to clarify the meanings of the various symbols used.
Analyse d'image
Analyse émotionnelle
Scénarios d'application
Game Development
Description: A strategic planning session for a game that takes place in a divided realm.
Utilisation potentielle: Utilize the map to create engaging narrative arcs and gameplay mechanics.
Political Analysis
Description: A geopolitical analysis discussion focusing on the two territories.
Utilisation potentielle: Use the map as a visual aid to discuss geopolitical tensions and collaborations between Vostria and Eletrax.
Educational Resource
Description: An educational tool for teaching about territorial divisions in geography classes.
Utilisation potentielle: Leverage the map to illustrate concepts of political geography and territorial boundaries.
Role-Playing Game Setup
Description: A backdrop for a role-playing game where players navigate between the two regions.
Utilisation potentielle: Employ the map to provide a visual representation of the game world and drive the story forward.
Cultural Study
Description: A thematic analysis of cultural distinctions between Vostria and Eletrax.
Utilisation potentielle: Utilize the map to explore cultural differences and interactions stemming from the territorial divide.
Analyse technique
Évaluation de la qualité: The map effectively illustrates the divide between two regions with clear visual markers.
- Clear representation of regions with color coding
- Prominent indicators for capitals and significant landmarks
- Legible legend for symbols used on the map
- Inclusion of more detailed geographical features
- Enhancing visual aesthetics for clarity
- Adding interactive elements for user engagement