由Flux AI Image Generator创建的AI图像
提示
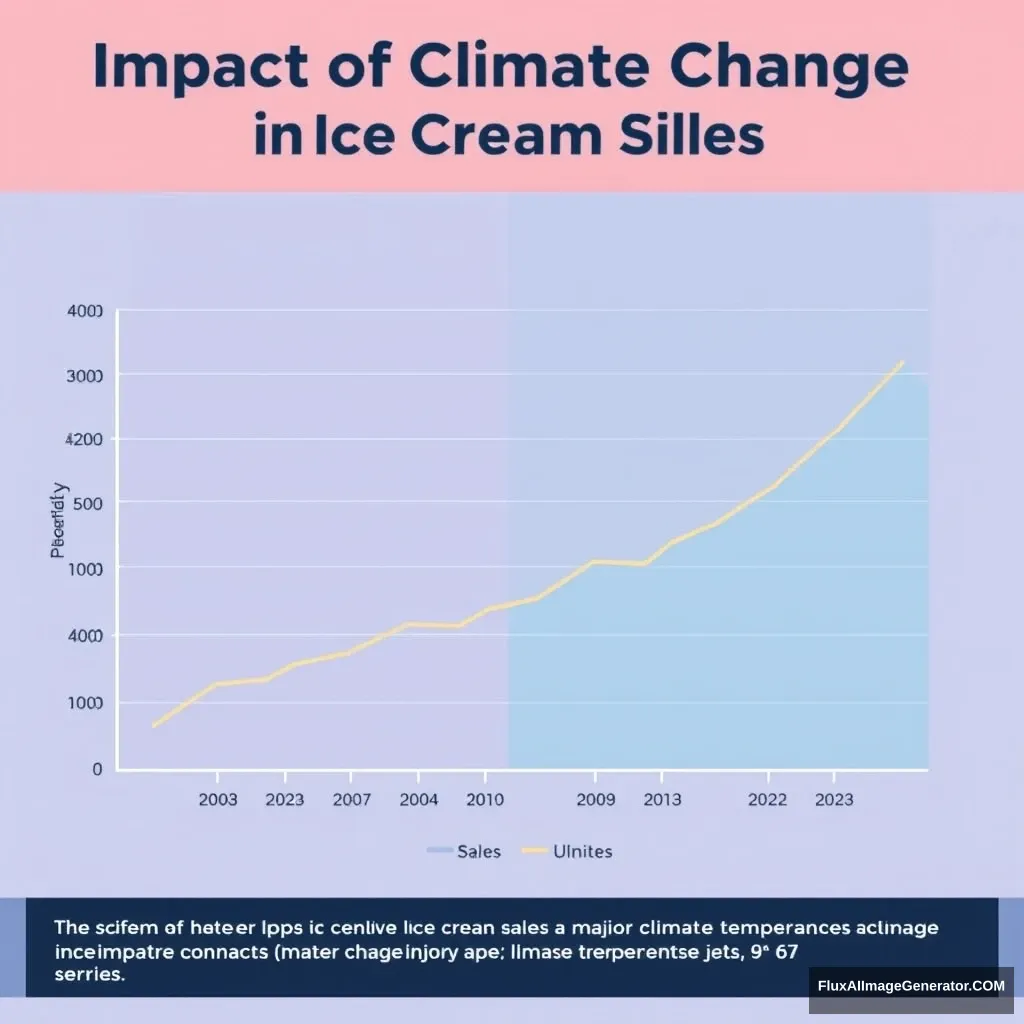
1. Title: ‘Impact of Climate Change on Ice Cream Sales’ 2. X-axis: ‘Year’ with labels for each year from 2003 to 2023. 3. Y-axis on the left: ‘Average Monthly Ice Cream Sales (in units)’ with appropriate scale. 4. Y-axis on the right: ‘Average Monthly Temperature (°C)’ with appropriate scale. 5. Two data series: one line for ice cream sales and another for temperature. 6. Legend identifying the two data series. 7. Clear, distinguishable colors for each data series. 8. Gridlines for better readability. 9. Annotation for significant events (e.g., heatwaves, major climate agreements) that may have impacted sales or temperature.
图像分析
情感分析
应用场景
Consumer Behavior Analysis
描述: Analyze the impact of temperature changes on consumer behavior.
潜在用途: To understand how climate variations affect product sales over time.
Sales Forecasting
描述: Forecast future ice cream sales based on projected climate data.
潜在用途: To develop sales strategies based on expected climate trends.
Marketing Strategies
描述: Create marketing campaigns around climate events.
潜在用途: To capitalize on heatwaves or other climate events that increase ice cream sales.
Academic Research
描述: Research studies on climate impact on food industries.
潜在用途: To provide insights for scholarly articles related to climate change effects on specific markets.
Inventory Management
描述: Plan inventory levels based on seasonal temperature fluctuations.
潜在用途: To optimize stock based on anticipated sales due to climate influences.
技术分析
质量评估: The design of the chart is well-structured and informative, but could benefit from enhanced clarity and detail.
- Dual Y-axis for comprehensive data presentation
- Inclusion of significant event annotations
- Use of color coding for easy differentiation of data series
- Increase data granularity for more precise analysis
- Incorporate additional variables such as marketing efforts
- Improve visualization for accessibility