由Flux AI Image Generator创建的AI图像
提示
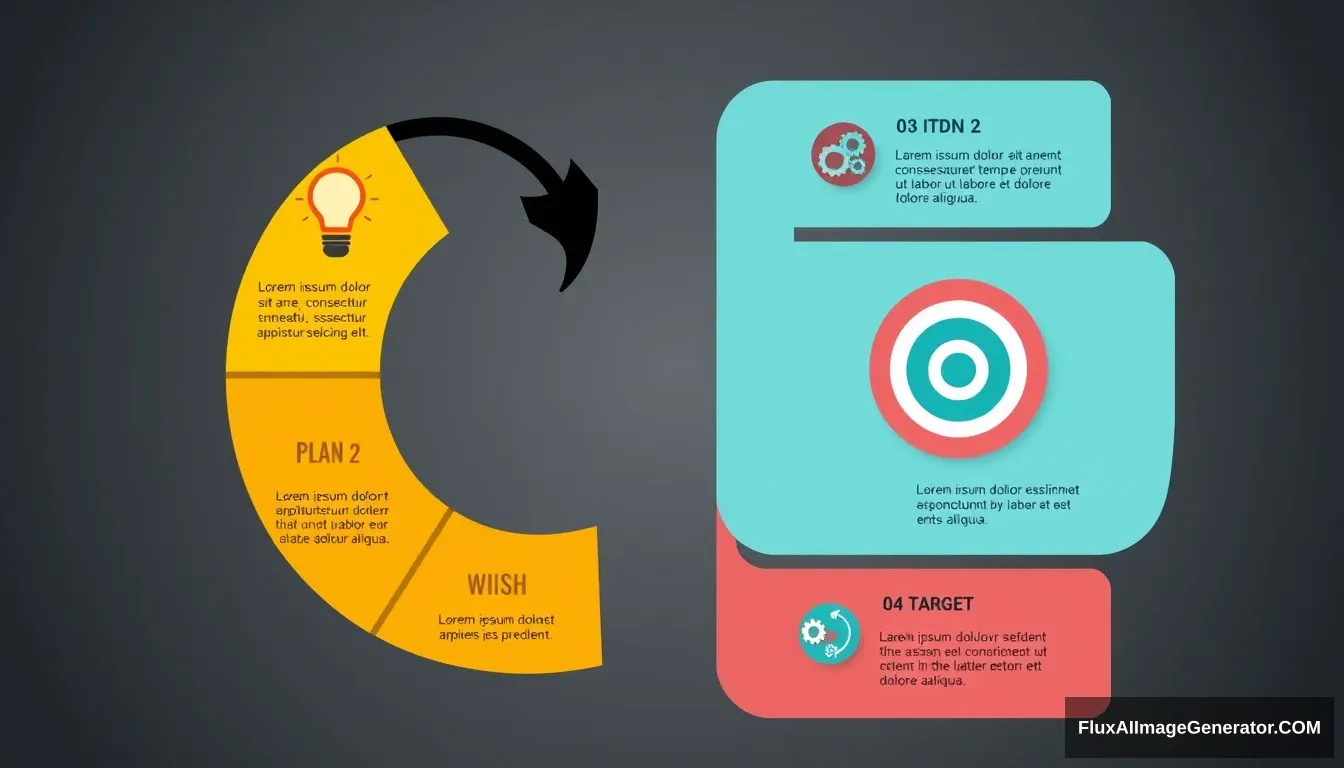
Business timeline infographic, circular diagram divided into 6 colored sections like a pie chart, resembling a snake or spiral. A thick black arrow wraps around the sections showing clockwise progression, with the arrowhead pointing to "FINISH". Section 1: "01 PLAN" icon of a light bulb in orange. Text "Lorem ipsum dolor sit amet, consectetur adipiscing elit. Sed do eiusmod tempor incididunt ut labore et dolore magna aliqua." Section 2: "02" icon of a megaphone in yellow. Section 3: "03 WORK" icon of gears in green. Text "Lorem ipsum dolor sit amet, consectetur adipiscing elit. Sed do eiusmod tempor incididunt ut labore et dolore magna aliqua." Section 4: "04 TARGET" dartboard icon in turquoise blue. Text "Lorem ipsum dolor sit amet, consectetur adipiscing elit. Sed do eiusmod tempor incididunt ut labore et dolore magna aliqua." Section 5: "05" diamond icon in purple. Section 6: "06 FINISH" checkmark icon in dark purple, with "SUCCESS" and smaller text.
图像分析
情感分析
应用场景
Project Timeline Overview
描述: Project management presentation
潜在用途: Visual representation of project stages for stakeholders.
Employee Training Timeline
描述: Staff onboarding process
潜在用途: Guide new employees through essential learning phases.
Campaign Steps
描述: Marketing campaign rollout
潜在用途: Outline phases of a marketing strategy for team coordination.
Development Roadmap
描述: Product development cycle
潜在用途: Track progress and phases for product launch.
Yearly Business Progress
描述: Company annual review
潜在用途: Highlight achievements and key stages over the year.
技术分析
质量评估: High quality with clear stages and visual appeal.
- Clear differentiation of sections using colors
- Use of icons enhances understanding of each phase
- Clockwise progression visually represents movement towards a goal
- Consider simplifying the text for clarity
- Use more visuals to enhance engagement
- Ensure color contrast for accessibility