Flux AI Image Generator로 생성된 AI 이미지
이미지 분석
감정 분석
응용 시나리오
Enhanced Visuals in Meetings
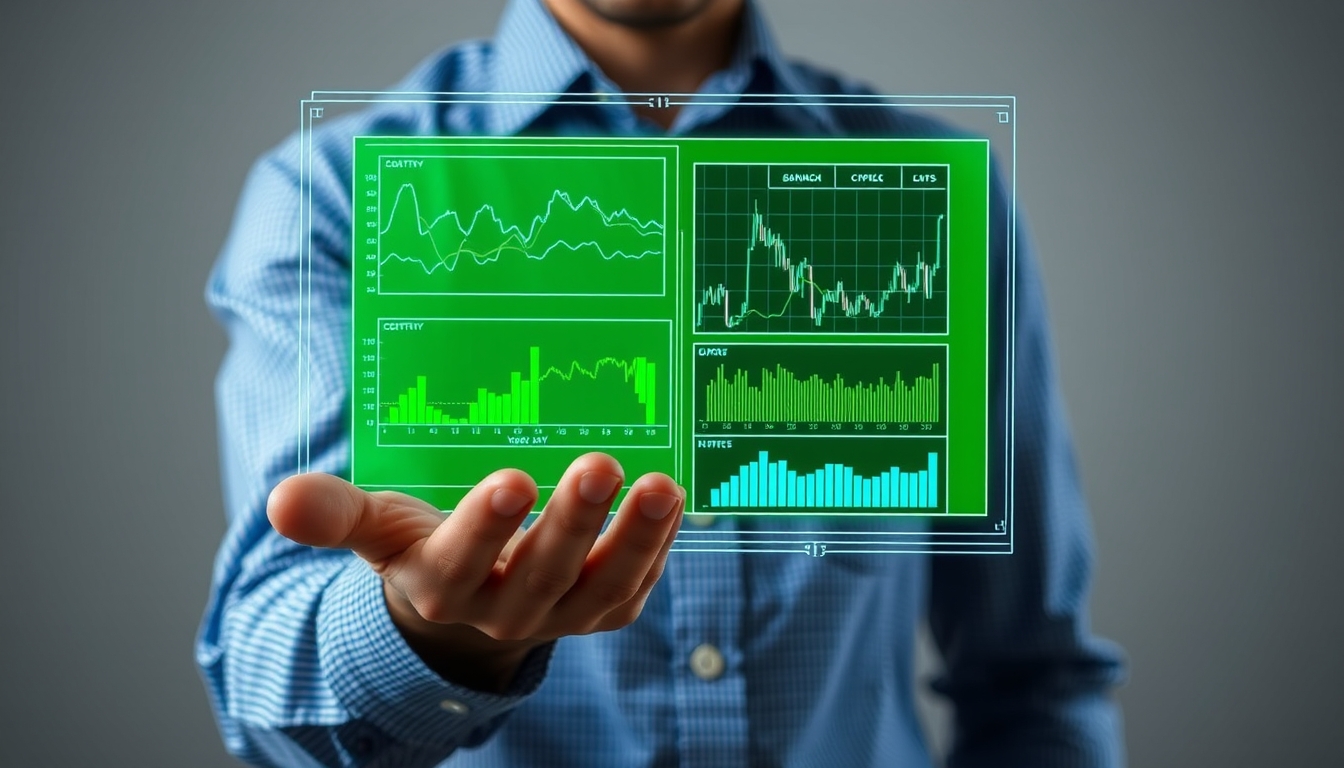
설명: Business Presentation
잠재적 사용: Utilizing holograms to display key metrics and performance graphs during client meetings or team briefings.
Interactive Learning Sessions
설명: Educational Demonstrations
잠재적 사용: Employing holographic displays in classrooms for dynamic lessons on statistics or data analysis.
Engaging Booth Displays
설명: Trade Shows
잠재적 사용: Creating attention-grabbing holographic representations of products and data to attract visitors at exhibitions.
Visual Data Sharing
설명: Remote Collaboration
잠재적 사용: Facilitating virtual teamwork where participants can view and interact with holographic data models during online meetings.
Medical Data Visualization
설명: Healthcare Applications
잠재적 사용: Displaying patient statistics and medical graphs in a 3D format for clearer understanding during consultations.
기술 분석
품질 평가: High quality; the imagery is realistic and effectively conveys data.
- Innovative use of holography for data representation
- Potential for real-time updates and changes to graphs
- Ability to enhance audience engagement through visualization
- Enhanced interactivity features
- Improved resolution for larger displays
- Better user interface for data manipulation
- Integration with more data sources