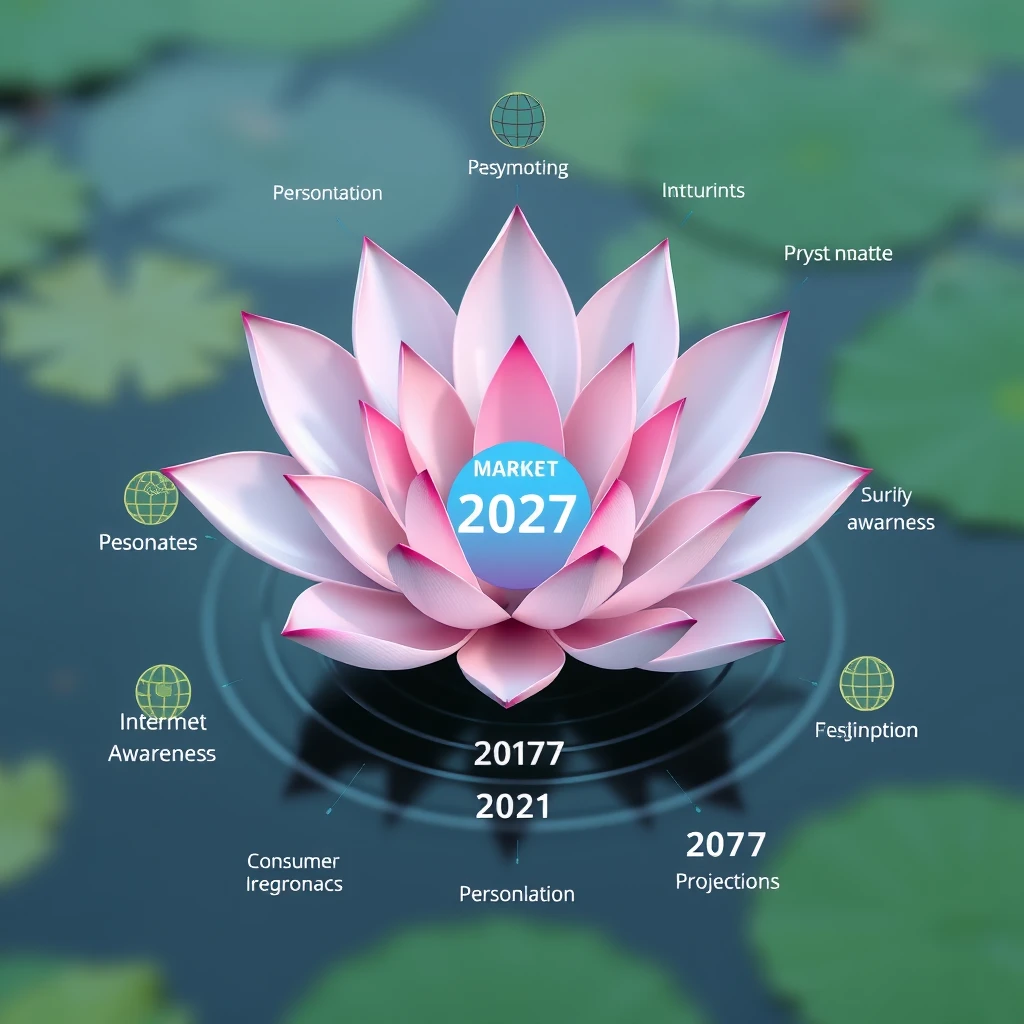
由Flux AI Image Generator創建的人工智慧圖像

提示
Create a visual representation of a lotus flower, where each petal represents a key factor contributing to market growth (e.g., internet penetration, consumer awareness, personalization). The center of the flower could show the current market value, with projections for 2027 illustrated as expanding ripples in the pond.
圖像分析
情感分析
應用場景
Lotus Flower Market Growth Visualization
描述: Market Analysis Presentation
潛在用法: To provide stakeholders with a clear understanding of the key factors driving market growth in a visual format.
Visual Representation for Investors
描述: Investor Pitch Meeting
潛在用法: To engage potential investors by highlighting growth factors and future projections in an easy-to-digest format.
Strategic Planning with Visuals
描述: Strategic Planning Session
潛在用法: To facilitate discussions around market strategies based on growth factors represented in the lotus flower layout.
Marketing Strategy Workshop
描述: Marketing Strategy Development
潛在用法: To visually identify and prioritize key growth drivers for marketing campaigns.
Educational Tool for Market Understanding
描述: Educational Seminar on Market Trends
潛在用法: To educate participants about market growth elements and their interconnections.
技術分析
質量評估: High quality with a clear and engaging design, though interactivity could enhance viewer experience.
- Clear visualization of complex market data
- Effective use of metaphor (lotus flower) to represent growth
- Ability to represent both current and projected data visually
- Increase interactivity in the visual representation
- Add more dynamic elements to engage viewers
- Incorporate comparative data to show market shifts over time