Flux AI Image Generatorによって作成されたAI画像

プロンプト
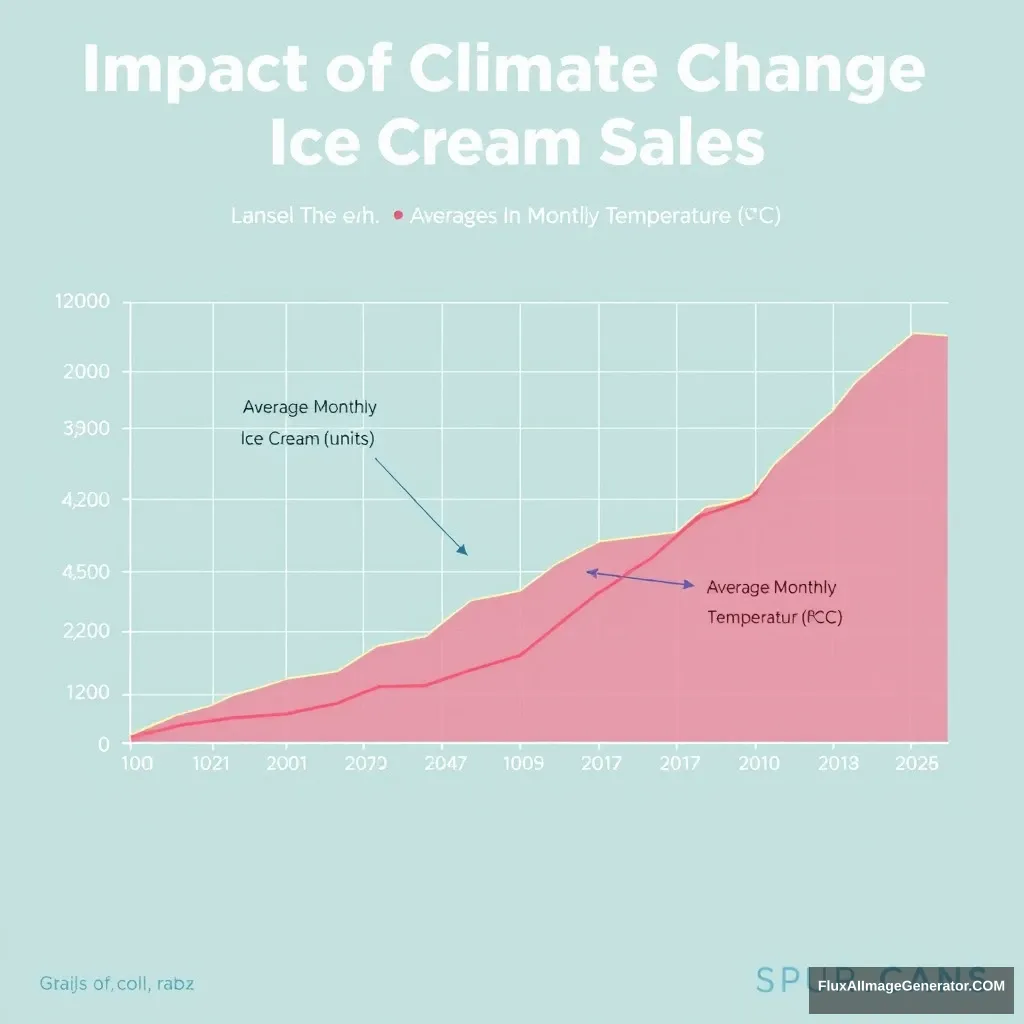
1. Title: ‘Impact of Climate Change on Ice Cream Sales’ 2. X-axis: ‘Year’ with labels for each year from 2003 to 2023. 3. Y-axis on the left: ‘Average Monthly Ice Cream Sales (in units)’ with appropriate scale. 4. Y-axis on the right: ‘Average Monthly Temperature (°C)’ with appropriate scale. 5. Two data series: one line for ice cream sales and another for temperature. 6. Legend identifying the two data series. 7. Clear, distinguishable colors for each data series. 8. Gridlines for better readability. 9. Annotation for significant events (e.g., heatwaves, major climate agreements) that may have impacted sales or temperature.
画像分析
感情分析
アプリケーションシナリオ
Sales Forecasting
説明: Analyzing historical data to forecast future ice cream sales based on climate trends.
潜在的な用途: Used by ice cream manufacturers to adjust production strategies.
Consumer Behavior Analysis
説明: Understanding consumer behavior in relation to temperature changes over the years.
潜在的な用途: Market research firms can utilize this information for targeted marketing campaigns.
Climate Change Awareness
説明: Demonstrating the relationship between climate change and seasonal products.
潜在的な用途: Educators and environmental groups can use this data to illustrate climate impact.
Policy Impact Study
説明: Impact assessment of climate policies on specific industries.
潜在的な用途: Government bodies can evaluate the effectiveness of climate policies.
Stakeholder Reporting
説明: Creation of a visual report for stakeholders on historical sales and climate correlation.
潜在的な用途: Business reports for stakeholders highlighting the importance of climate awareness.
技術分析
品質評価: High quality in representing the correlation between temperature and sales data but could benefit from more detailed analysis.
- Use of dual-axis for clearer comparison
- Incorporation of event annotations for contextual understanding
- Effective use of gridlines for better readability
- More refined data points for individual years
- Inclusion of regional sales data
- Improved annotations detailing specific events