Flux AI Image Generator
Open main menu
Flux.1
無料ツール
Flux Lora Models
New
価格
Toggle theme
JA
Sign in
Flux AI Image Generator
Close menu
Flux.1
無料ツール
Flux Lora Models
New
価格
Toggle theme
JA
Sign in
7 Free Data Visualization AI images Create by
Flux AI
Flux.1 AI Image Generator
Flux Schnell
Flux Dev
Flux Pro
Related Tags
Accounting Automation
Financial Technology
Data Visualization
Marketing Materials
Professional Design
3D Pie Charts
Business Presentations
Workspace Organization
Marketing Strategies
Urban Landscape
Business Icons
High Contrast Visuals
Futuristic Design
Graphs
Visual Aids
3D Graphs
Pie Charts
Organized Workspace
Python
Animation
iPython
Interactive Coding
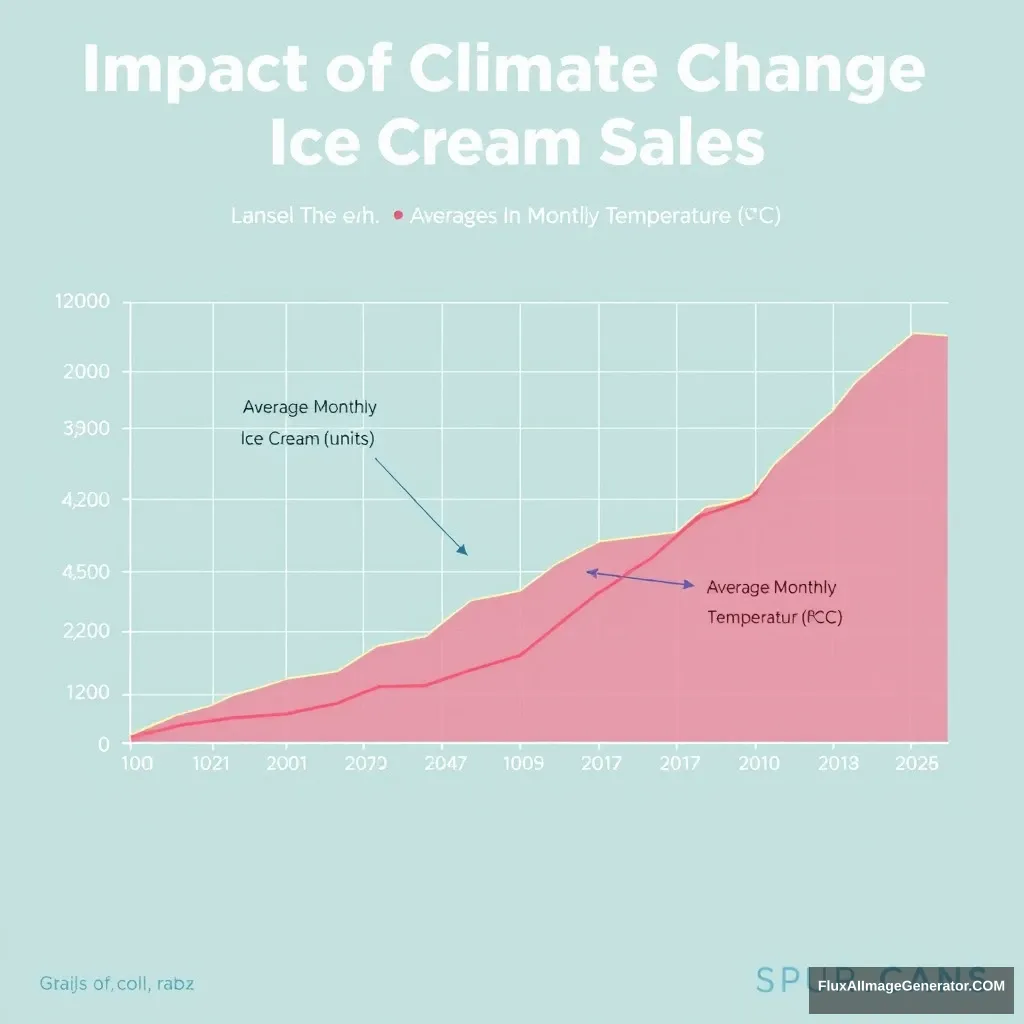
Climate Change
Ice Cream Sales
Consumer Behavior
Market Analysis